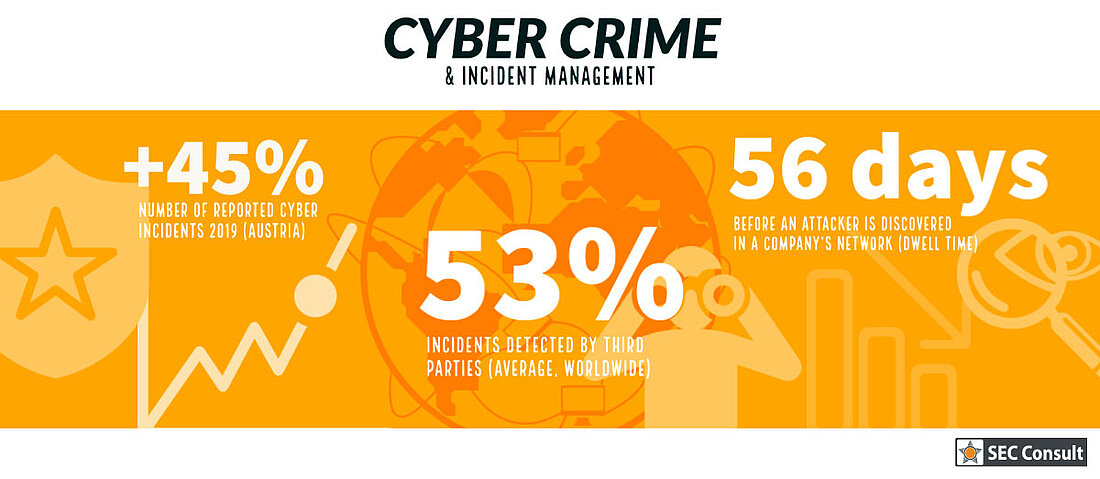
Of course, the number of externally reported incidents should be kept as low as possible in relation to those that have been noticed internally. The internal visibility is therefore not as good as that of attentive third parties. Many companies are often not adequately prepared and there is a lack of resources to handle a security incident successfully.
Unfortunately, a lack of visibility makes it difficult even for the best incident responders. External cybersecurity incident response teams (CSIRTs) usually start processing a network that is completely unknown to them. To provide analysts with the necessary information to investigate and remediate the attack, a basic level of visibility needs to be established.
This step consists of four tasks:
- Increase the level of detail of the log
- Set up a central log management system
- Transfer logs from the host to the log management system
- Increase log coverage
We will look into each one of these for tasks from the POV of rapid implementation in unprepared networks.
INCREASE THE LEVEL OF DETAIL IN THE LOG
You need to improve logging on the host to give the analyst as much information as possible about what is happening on a host, such as failed and successful login events. Started processes are important in order to get an idea of how the system is being used and to be able to track suspicious activities like an attacker. Keep on reading for explanations including best practices and available configurations for both Windows and Linux systems.
A. Windows
With the right configuration, the Windows Event Log[17] does offer solid logging functionality. Sysmon from the SysInternal Tools[3] is another great possibility for logging on Windows systems, which is often used as an extensive extension to the normal Windows Event Logs.
1) Windows Event Log
Since the default settings of the Windows Event Logs are not sufficient to give incident responders the necessary insight into the activities of a system, the log size needs to be adjusted. The standard settings have a relatively short rotation time at host level, which would be shortened even more if the level of log detail was increased. Please keep in mind that the right size depends on the environment and the system. The following recommendations are based on a publication by the Australian Cyber Security Center. [4]
Increase the maximum size of the Security Event Log to 2 GB and the size of the application and system event logs to 64 MB. The most important areas in log improvement are as follows:
- User accounts (logins, lockouts, modifications, NTLM authentication)
- Persistence mechanisms, credential access, and lateral movement techniques (scheduled tasks, services, file shares, WMI, object access, PowerShell)
- Anti Virus (EMET, Windows Defender, logs from 3rd party AV solutions)
- Process execution (process tracking – if Sysmon is not available, AppLocker, Windows Error Reporting, code integrity)
If an attacker were to manipulate the event logging, stop it, or delete the event logs, events in connection with the logging itself are also of great importance [4]. For a rapid implementation at the customer’s, the predefined changes to the audit policies can be done via GPOs.
2) Sysmon
Sysmon is an abbreviation for System Monitor. It is a free tool developed by Microsoft that offers extended functionalities compared to the normal Windows Event Log. Sysmon can be adapted to the requirements of the network thanks to the flexible filter options. Also, the functionality of the IMPHASH calculation of the executed program is also worth a look. Individual parts, such as the called APIs, are hashed in this process, which enables the detection and correlation of modified malware to bypass anti-virus solutions. [3]
Ideally, the Sysmon configuration should be adapted to the requirements of the company network. However, a preconfigured configuration file is recommended for quick use. A publicly available configuration of good quality can be found in the Swift On Security GitHub repository [5]. Later, the configuration can be optimized iteratively. Sysmon is usually deployed via the software management platform established in the company, for example SCCM, or via GPOs. [4]
B. Linux
The Linux Auditing System (auditd), is the Linux counterpart to the Windows Event Log or Sysmon. It is highly configurable and offers excellent insight into the processes on Linux systems. Florian Roth’s configuration file [6] can be used as the starting point for rapid implementation. It enables high-quality logging which, like the Sysmon configuration, can also be optimized iteratively. Since the standard maximum log size is often too small for a highly active system, the optimal size depends on the activity, the level of logging, and the available resources of the system. You can find more information about logging on Linux systems here [7].
CENTRAL LOG MANAGEMENT SYSTEM
The next step for increasing visibility in the corporate network is the implementation of a central log management system. Central log management has several advantages. The size of the logs on the hosts can be kept smaller without disadvantages like visibility into the past. The storage is centralized and can be adapted to the desired retention time and handed over to long-term archiving. Access to central log management must be strictly secured and monitored.
Removing or manipulating the logs on the hosts – if they have already been sent to the log management system – has no effect and can be recognized. Further benefits of the system include enhancement of logs by submitting relevant information, correlation of related events, triggering of alarms in suspicious activities. Since the investigation can be carried out in one place and the analysts don’t have to physically move from system to system, system analysis is much easier and more efficient. [8]
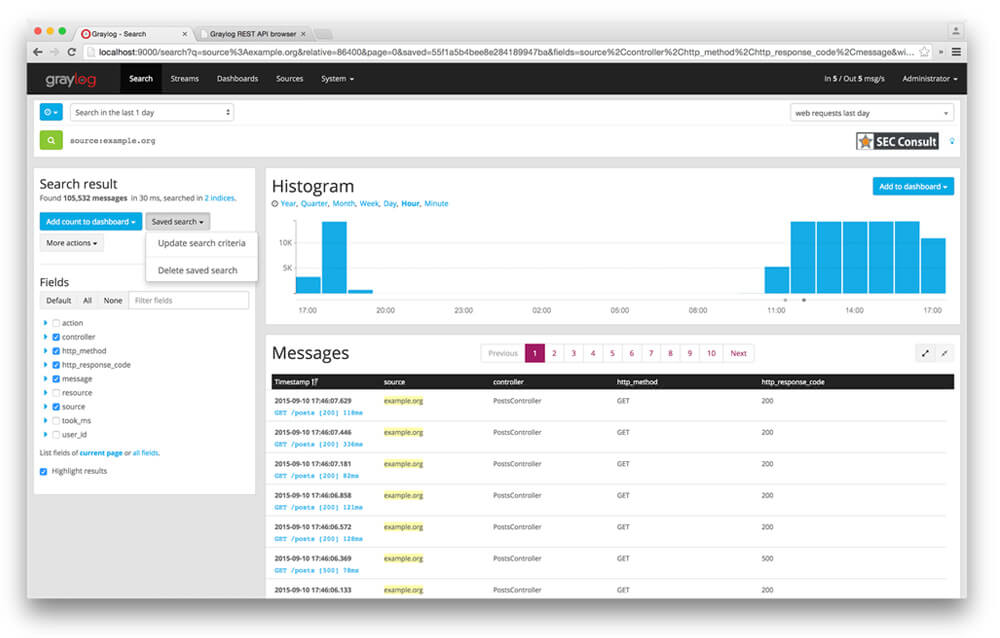
Two well-known open-source log management systems are ELK Stack and Graylog.
A. ELK Stack
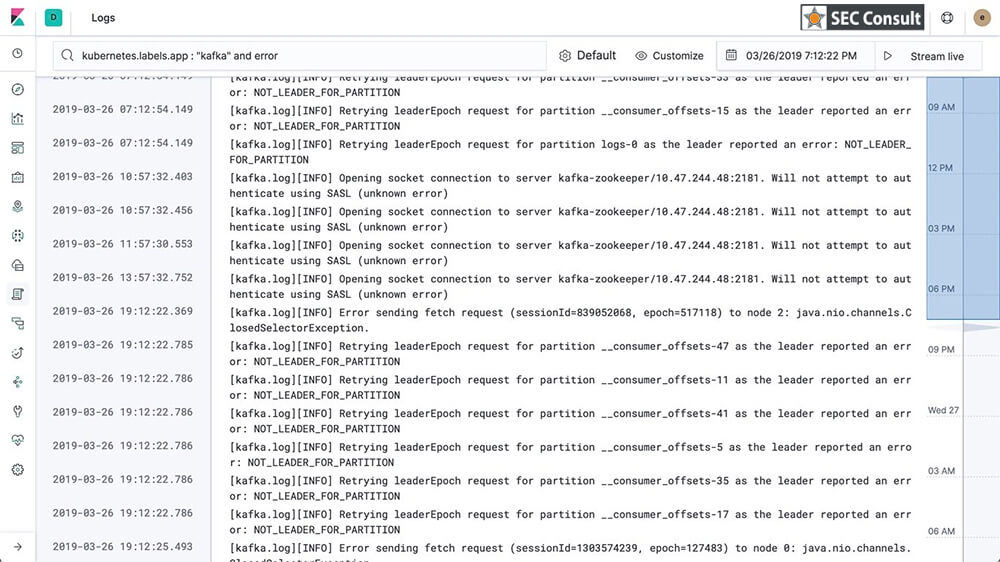
The ELK Stack[9] is one of the most common open-source log management systems. It is a fusion of the three open source projects Elasticsearch, Logstash, and Kibana. The former is an engine for indexing, search, and analytics. The second is a pipeline for data processing, which simultaneously collects, transforms data from various sources, and forwards it to Elasticsearch. The latter provides the graphical user interface that analysts can use to search the data, create charts, graphs, and dashboards. Individual tools for transferring files, such as logs, were subsequently added. This functionality was called Beats and led to the renaming of the project to Elastic Stack. We will look into this in the next chapter.
Using Kibana, analysts can search the collected logs or create alerts, e.g. to draw attention to discovered Indicators of Compromise (IOCs). The following figure shows the output of a search on Kibana:


