Enhancing Network Security: Monitoring Client Communication with Velociraptor

defence

SEC Defence, the managed incident response unit of SEC Consult, developed a set of Velociraptor artifacts to enable monitoring of current network communication on enrolled clients and alerting on specific connections, e. g. to known malicious IP addresses or connections created by known malicious processes.

Figuren im Social Network

Our trigger for this development was a recent ransomware case that we investigated using Velociraptor. During the investigation of the incident, a monitoring for known IOCs was requested, to alert on possible second attack waves or remaining malware and backdoors in the environment. Due to special circumstances, monitoring using central network components, like a firewall, could not be relied on – a different solution was needed. As Velociraptor was already rolled out, it was a prime target to utilize for this task. During implementation, we realized that Velociraptor has no pre-made monitoring of network communication on clients.

In the following, we lay out our thoughts from the creation process of the new artifacts as well as share our results with the DFIR community.

Reasons for Monitoring Network Communication on the Client

Many attacker actions require network communication:

  • Scanning of internet-exposed elements of the infrastructure of a company
  • lateral movement through a breached environment
  • exfiltration of sensitive and valuable data back to attacker-controlled infrastructure

Ideally, a company implemented monitoring on a network level, allowing visibility into current and past communication between internal systems as well as with external systems. This allows detection and investigation of possible attacker actions.

When a comprehensive network view is missing, one can try to compensate with monitoring on each host for its network communication (host-based network monitoring). This will not cover all network communication, only those connections involving the systems included in the host-based view.

Still, when a large portion of the internal systems is covered, identification of malicious activity is possible. In an incident where Velociraptor is used for investigation, it can be utilized for such host-based monitoring.

Building Blocks

Velociraptor includes several client monitoring artifacts which can serve as a reference for implementations. Initial inspiration was taken from Windows.Events.ProcessCreation and Windows.Events.TrackProcessesBasic. These Velociraptor artifacts show different ways of tracking changes on the system.

To identify network communication, Velociraptor has artifacts for Windows, Linux and MacOS. From the Windows and MacOS variants, one is lead to the Velociraptor internal plugin netstat. This plugin is not bound to any operating system. However, these Velociraptor artifacts and the Velociraptor plugin only provide a snapshot of the network communication at the time of execution.

Velociraptor includes the internal plugin diff which allows for periodic execution of a non-event query (meaning a query returning one time results) and highlights changes in the output of the query based on a custom comparison.

Putting Blocks Together

The client monitoring artifact we developed can be found at:

https://docs.velociraptor.app/exchange/artifacts/pages/generic.events.tracknetworkconnections/ 

The artifact utilizes the netstat plugin to get information about the network communication. This is wrapped with the diff plugin, so that the network communication is periodically polled and checked for changes. Changes are identified based on following elements: process id, layer 3 protocol, layer 4 protocol, local address used, local port used, remote address used, remote port used. We believe that those elements sufficiently uniquely identify a network communication (edge cases may apply, e. g. when a process repeatedly opens a connection to the same remote endpoint reusing the local port). Changes are by default checked every two seconds. Short lived connections might fall through that crack. This is a limitation of the diff plugin, as the interval between checks can be made no shorter than one second.

After some testing, we found that the information given by the netstat plugin should be enriched with information about the process that initiated the network communication. Depending on which process initiated a network communication, the judgement on it being benign or suspicious changes. We utilized the Velociraptor internal function process_tracker_get to retrieve process information based on the PID associated with a network connection.

The client monitoring artifact emits events for both added network connections as well as removed network connections.

No Artifact Works Alone

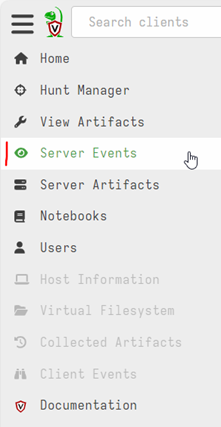
The client monitoring artifact is sufficient to track network communication on the level of IP addresses and ports. But it only informs the Velociraptor server about the network communication. The server also needs a kind of companion server monitoring artifact which reacts to the events from the clients.

We developed a second Velociraptor artifact which watches for events from the earlier artifact and sends a notification on added network connections using a webhook. To combat spam and also focus the alerting on specific IOCs, we added filtering for specific clients (based on their Fqdn), remote IP addresses, remote ports as well as initiating process.

The server monitoring artifact can be found at:

https://docs.velociraptor.app/exchange/artifacts/pages/server.alerts.tracknetworkconnections/ 

If desired, the server monitoring artifact could also trigger other actions instead of or additional to the webhook message. These might include starting evidence collection on the client that emitted the event, killing the process responsible for the network communication or moving the client into quarantine.

How To Configure In Practice


As the two artifacts use functionalities less commonly utilized in Velociraptor, we give a short overview on how to use them.

First, we need to import both artifacts into your Velociraptor server and prepare a webhook to send alerts to. Setup of a tool for managing alerts with support for webhooks for creating such alerts is outside the scope of this blog post.

We need to tell Velociraptor that it should do specific monitoring on endpoints. In the Server GUI, this is done via the "Client Events" tab:


The tab is conveniently inaccessible as long as we have no endpoint selected. So go and select any random enrolled client and then switch to the tab.

From the header tab menu, the first option lets us change the configuration for client monitoring:

Choose the "label group" for which to apply your monitoring, and then we are ready to choose our artifact. Be aware: Client Monitoring uses special artifacts (type CLIENT_EVENT) - you will not find your usual artifacts here!

Choose the artifact Generic.Events.TrackNetworkConnections, change the parameters as needed and launch it.

Congratulation: Velociraptor will now monitor on the defined "label group" for the network communication of each client. But we are not done yet: Currently, we only monitor, informing the Velociraptor Server of changes in the network communication of clients, but not taking any actions.

We need to switch to the server side of Velociraptor to configure actions to be taken. In the Server GUI, this is done with the "Server Events" tab:

From the header tab menu, the first option lets you change the configuration for server monitoring.

There, you can immediately choose artifacts to run. Be aware: Server Monitoring uses special artifacts (type SERVER_EVENT) - you will not find your usual artifacts here!

We choose the artifact Server.Alerts.TrackNetworkConnections. In the parameters, we input our prepared webhook URL. The other parameters can be adjusted as needed. Then we launch it.

Depending on the size of clients you are monitoring with the artifact and the filtering you made with the parameters, you might have many alerts to go through now :D

Recommendations

Windows systems, that are actively used, communicate with many external endpoints. Server systems have by their nature a lot of network communication. If the host-based network monitoring is deployed without filtering, one will create an avalanche of alerts. This will overload any person responsible for reacting to these alerts. The following are some personal recommendations for using these artifacts.

In an incident response situation, you could use the parameters in the server monitoring artifact to filter for malicious IPs related to the attacker. Alternatively, you might filter for systems which you suspect the attacker will be active on in the future. This will reduce the amount of alerts while also focusing on likely malicious communication.

In a threat hunting situation, you might want to run the client monitoring artifact for a few days and then directly download the raw data (JSON or CSV) for further processing, skipping the alerting through the server monitoring artifact. This will deliver the data about client network communication without overloading anyone with alerts.

Conclusion

With these two new artifacts, we extended Velociraptor to enable continuous monitoring of network communication of enrolled clients and alerting on it (with custom filtering as needed). This is a powerful and versatile new functionality for Velociraptor.

The artifacts are available through the Velociraptor Artifact Exchange:

We wish the DFIR community much fun with this contribution. Happy Hunting!


This blogpost has been conducted by Herbert Bärschneider and published on behalf of SEC Defence

About the author

Herbert Bärschneider

Associate Security Consultant

Herbert works as a forensic analyst in the Managed Incident Response team of SEC Consult. In parallel to his operational work, he is finishing a masters program and explores niche operating systems for forensic artifacts. He values giving back to the community by contributing to triage and threat hunting capabilities.